ESG Data
View the performance data on our ESG initiatives.
Environment
External Certification of Environmental Management System
ISO 14001: 2015 Certification Status (As of February 2026)
| Company name | Date of certification | |
|---|---|---|
| Head office | Head Office and Otsu Plant | August 27, 1999 (multi-certification at four plants) |
| Shiga-Takatsuki Plant | ||
|
Notogawa Plant |
||
|
Precision Glass Center |
||
| Group companies in Japan | SGS Engineering Co., Ltd. | January 19, 2001 |
| Nichiden Glass Processing Co., Ltd. | November 1, 2002 | |
| LTCC Materials Co., Ltd. | December 25, 2020 | |
| Overseas Group companies | Techneglas LLC | January 31, 2000 |
| Nippon Electric Glass (Malaysia) Sdn. Bhd. | January 12, 2002 | |
| Nippon Electric Glass Taiwan Co., Ltd. | September 18, 2006 | |
| Paju Electric Glass Co., Ltd. | August 28, 2007 | |
| Electric Glass (Shanghai) Co., Ltd. | December 21, 2009 | |
| Electric Glass (Guangzhou) Co., Ltd. | November 11, 2015 | |
| Electric Glass (Xiamen) Co., Ltd. | April 17, 2017 | |
| Electric Glass (Nanjing) Co., Ltd. | April 13, 2018 | |
Waste Reduction
Internal Classification of Waste
-
Internal Recycling A
Spent polishing agents, glass shards, and other materials useful in-house as recycled raw materials
-
Social Recycling B
Scrap metal, scrap bricks, waste paper, scrap plastic (recycled), and other materials, which have value externally as reusable materials
-
Corporate Recycling C
Scrap plastic (converted to fuel), waste oil, wood scrap, and other materials, which we pay to have recycled outside the company
-
Landfill Waste D
Incombustible materials, incinerated ash, waste refractories, and other materials that we pay to have disposed of in landfills outside the company and not recycled
Percentage of Sales Weight of Normal Waste, Excluding Landfill Waste D
(%)
| FY2023 | FY2024 | FY2025 | |
|---|---|---|---|
| Consolidated | 7.2 | 5.6 | 6.5 |
| NEG | 0.01 | 0.01 | 0.01 |
Breakdown of Plastic Emissions in Japan
(ton)
| Category | FY2023 | FY2024 | FY2025 |
|---|---|---|---|
| Plastic emissions in Japan | 933 | 969 | 1,201 |
| Social Recycling B | 311 | 299 | 738 |
| Corporate Recycling C | 617 | 670 | 463 |
| Landfill Waste D | 5 | 0 | 0 |
Reduction of Water Consumption
Water Withdrawal/Waste Water per Total Weight of Products Sold
(m3/ton)
| FY2023 | FY2024 | FY2025 | |
|---|---|---|---|
| Water Withdrawal | 8.4 | 7.6 | 7.7 |
| Waste Water | 5.7 | 5.0 | 4.7 |
Analysis of Environmental Impact (Consolidated)
Input
| Unit | FY2021 | FY2022 | FY2023 | FY2024 | FY2025 | ||
|---|---|---|---|---|---|---|---|
| Energy sources used | Total energy | (GWh) | 5,990 | 5,935 | 4,430 | 3,976 | 3,816 |
| Electricity | (GWh) | 2,337 | 2,433 | 2,050 | 1,997 | 1,955 | |
| Fuel | (GWh) | 3,653 | 3,502 | 2,380 | 1,978 | 1,861 | |
| Water | Water withdrawal | (1,000 m3) | 8,268 | 8,267 | 6,457 | 5,887 | 5,635 |
| Municipal water | (1,000 m3) | 4,063 | 3,990 | 3,357 | 3,128 | 2,964 | |
| Groundwater | (1,000 m3) | 1,734 | 1,810 | 1,549 | 1,390 | 1,472 | |
| Rainwater | (1,000 m3) | 135 | 171 | 165 | 157 | 148 | |
| Industrial water | (1,000 m3) | 2,258 | 2,140 | 1,343 | 1,211 | 1,051 | |
| Others | (1,000 m3) | 77 | 156 | 42 | 0 | 0 | |
| Recycled water | (1,000 m3) | 217,489 | 326,680 | 282,553 | 255,852 | 243,903 |
Output
| Unit | FY2021 | FY2022 | FY2023 | FY2024 | FY2025 | ||
|---|---|---|---|---|---|---|---|
| Atmosphere | CO₂ | (1,000 tons) | 1,881 | 1,797 | 1,395 | 1,328 | 1,352 |
| Scope1 | (1,000 tons) | 871 | 790 | 543 | 466 | 444 | |
| Scope2 | (1,000 tons) | 1,010 | 1,008 | 852 | 862 | 907 | |
| SOx | (ton) | 96 | 133 | 109 | 71 | 79 | |
| NOx | (ton) | 2,524 | 2,506 | 1,508 | 1,541 | 1,454 | |
| Particulate matter | (ton) | 216 | 242 | 205 | 183 | 167 | |
| Water | Waste water | (1,000 m3) | 5,034 | 4,651 | 4,366 | 3,853 | 3,489 |
| Waste | Total amount generated | (1,000 tons) | 150 | 141 | 112 | 97 | 101 |
| Internal Recycling A | (1,000 tons) | 31 | 33 | 25 | 21 | 26 | |
| Total emissions | (1,000 tons) | 118 | 109 | 87 | 76 | 75 | |
| Social Recycling B | (1,000 tons) | 13 | 13 | 12 | 14 | 12 | |
| Corporate Recycling C | (1,000 tons) | 28 | 22 | 16 | 16 | 13 | |
| Landfill Waste D | (1,000 tons) | 77 | 73 | 59 | 46 | 50 |
Environmental Accounting (NEG)
Environmental Conservation Costs
(Million yen)
| Category | Main activities | FY2024 | FY2025 | |||||||
|---|---|---|---|---|---|---|---|---|---|---|
| Investment | Expenses | Investment | Expenses | |||||||
| (1) Costs within operational area | Costs to reduce environmental footprint of production activities within operational area | 3,382 | 2,200 | 6,023 | 2,679 | |||||
| Breakdown | 1. Anti-pollution maintenance and management cost | 12 | 548 | 29 | 735 | |||||
| 2. Global environmental conservation costs | 3,127 | 181 | 5,979 | 29 | ||||||
| 3. Resource recycling costs | 243 | 1,471 | 14 | 1,914 | ||||||
| (2) Upstream and downstream costs | Costs to reduce environmental footprint of upstream and downstream production activities | Costs for green procurement, product recycling, container and packaging recycling, environmental conservation measures | - | 376 | - | 360 | ||||
| (3) Costs of management activities | Environmental conservation costs within management activities | Costs for environmental education, ISO 14001 system construction and maintenance, and measuring of environmental footprint; labor costs of environmental managers | 14 | 742 | 11 | 820 | ||||
| (4) Research and development Costs | Environmental conservation costs of R&D activities | Expenses related to the development of environmentally friendly products, expenses related to production technology designed to reduce environmental impact | 178 | 889 | 0 | 560 | ||||
| (5) Costs for social initiatives | Environmental conservation costs of social initiatives | Beautification and tree-planting activities for harmonious coexistence with local communities, support for local communities, environment-related advertising costs, afforestation | - | 94 | - | 69 | ||||
| (6) Environmental remediation costs | Costs to deal with damage to the environment | Environmental restoration expenses | - | 5 | - | 28 | ||||
| (7) Other costs | Other costs relating to environmental conservation | Expenses for dismantling and removal of environment-related equipment and facilities | 29 | 27 | 43 | 87 | ||||
| Total | 3,603 | 4,333 | 6,079 | 4,519 | ||||||
-
Of investment and expenses, only those amounts clearly related to environmental concerns have been aggregated. In regard to production facilities and R&D, only sections related to the environment have been included.
Investment Amount
(Million yen)
| Category | Main activities | FY2024 | FY2025 |
|---|---|---|---|
| Total investment | Scheduled repair of glass melting furnaces and production rationalization investment, investment to improve manufacturing productivity of major products | 25,209 | 49,137 |
| Total research and development costs | Development and improvement of process technology, and development of products, including glass for displays and glass for electronic devices | 7,556 | 8,605 |
| Sales Amount of Valuable Materials Related to “Environmental Conservation Costs” (1) 3. | Sales of scrap metal, scrap bricks, etc. | 70 | 69 |
| Sales Amount of Valuable Materials Related to “Environmental Conservation Costs” (2) | 0 | 0 |
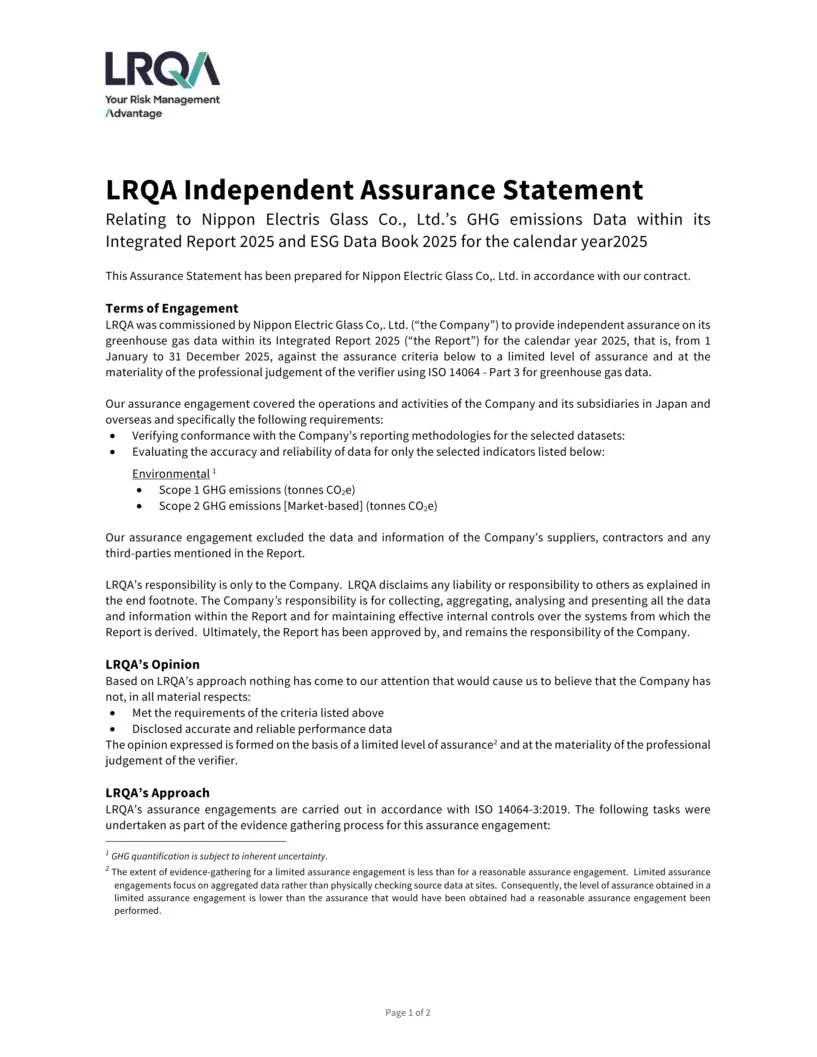
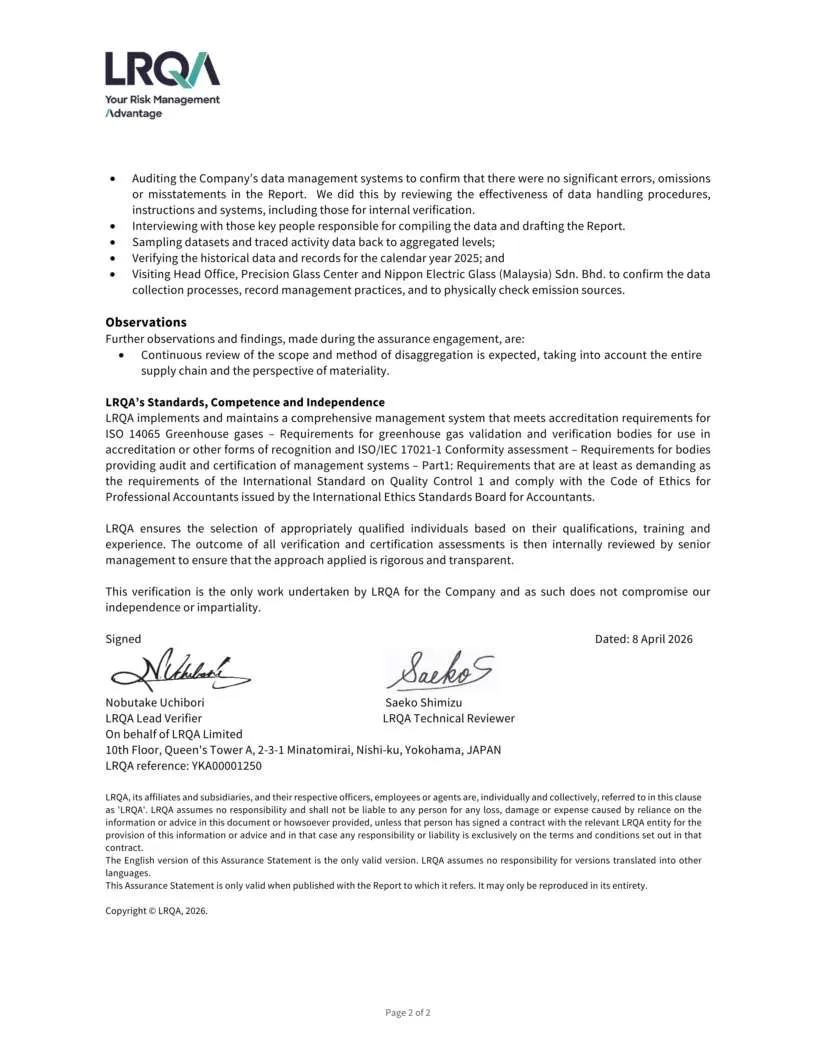
Third-party Assurance Statement (Scope 1 and 2)
Social
Hiring a Diverse Workforce
Employment of People with Disabilities
Percentage of Employees with Disabilities (NEG and consolidated subsidiaries in Japan)
(%)
| FY2021 | FY2022 | FY2023 | FY2024 | FY2025 | |
|---|---|---|---|---|---|
| NEG | 4.3 | 4.3 | 4.1 | 3.9 | 4.0 |
| Statutory employment rate in Japan | 2.3 | 2.3 | 2.3 | 2.5 | 2.5 |
| National average | 2.2 | 2.3 | 2.3 | 2.4 | 2.4 |
Hiring Mid-Career Professionals
Career Recruitment
| Unit | FY2021 | FY2022 | FY2023 | FY2024 | FY2025 | |
|---|---|---|---|---|---|---|
| Percentage of mid-career hires | (%) | 39 | 52 | 32 | 46 | 56 |
| Number of mid-career hires | (Persons) | 24 | 44 | 29 | 53 | 73 |
| New graduate hires | (Persons) | 37 | 41 | 80 | 63 | 58 |
Human Resource Development
Education and Training Held
| FY2023 | FY2024 | FY2025 | ||
|---|---|---|---|---|
| Training hours (under head office education section) | 61 hours/person | 49 hours/person | 44 hours/person | |
| Training cost | NEG | 392 million yen | 329 million yen | 316 million yen |
| Consolidated |
ー | ー | 364 million yen | |
| Per person (NEG) | 229 thousand yen | 189 thousand yen | 177 thousand yen | |
Global Communications Program (GCP) Number of Participants
| FY2021 | FY2022 | FY2023 | FY2024 | FY2025 |
|---|---|---|---|---|
| 119 | 125 | 162 | 151 | 146 |
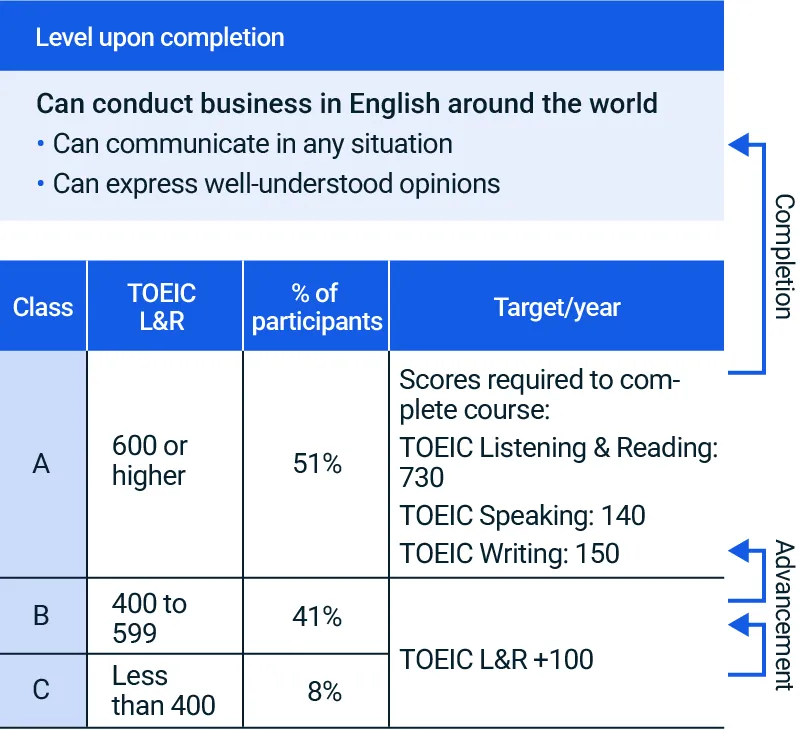
Global Communications Program (GCP)
Goals and Completion Levels
Efforts to Retain and Empower Employees
Progress in Diverse Work Styles and Work Efficiency
Number/Percentage of Paid Leave Days Taken
| Unit | FY2021 | FY2022 | FY2023 | FY2024 | FY2025 | |
|---|---|---|---|---|---|---|
| Percentage of days taken | (%) | 66 | 75 | 78 | 78 | 74 |
| Days taken | (Days) | 15.9 | 18.0 | 18.8 | 18.6 | 17.8 |
-
Paid leave days/year: 24
Average Overtime Work
(Hours)
| FY2021 | FY2022 | FY2023 | FY2024 | FY2025 | |
|---|---|---|---|---|---|
| Average overtime work per month | 18.4 | 17.4 | 14.4 | 16.7 | 17.2 |
Support for Raising the Next Generation
Childcare Leave Utilization Rate and Percentage of Women Returning to Work (NEG)
(%)
| FY2021 | FY2022 | FY2023 | FY2024 | FY2025 | |
|---|---|---|---|---|---|
| Utilization rate for women*1and % returning to work*2 | 100 | 100 | 100 | 100 | 100 |
| Average utilization rate for women*4 | 85 | 80 | 84 | 87 | - |
| Utilization rate for men*3 | 31 | 58 | 86 | 84 | 108 |
| Average utilization rate for men* 4 | 14 | 17 | 30 | 41 | - |
-
Utilization rate for women: Number of people taking childcare leave ÷ number of employees giving birth × 100
-
Percentage of women returning to work: After giving birth, percentage of people working continuously when child has turned 1 year old
-
Utilization rate for men: Number of men taking childcare leave ÷ number whose spouses gave birth × 100. The utilization rate may exceed 100%, as male employees whose spouses gave birth in the previous fiscal year may take childcare leave in the current fiscal year.
-
Source: Statistics on national average childcare leave utilization rate for men and women, taken from Basic Survey of Gender Equality in Employment Management; Ministry of Health, Labour and Welfare
Women’s Empowerment
Trends in Indicators for the Promotion of Women's Activities
(%)
| FY2021 | FY2022 | FY2023 | FY2024 | FY2025 | |
|---|---|---|---|---|---|
| Percentage of female employees (including workers on loan) | 8.8 | 9.0 | 9.9 | 9.8 | 10.2 |
| Percentage of female managers (including workers on loan) | 1.4 | 1.0 | 1.2 | 1.3 | 2.3 |
| Percentage of new female employees (new graduates in career-track positions) | 20.8 | 33.3 | 25.5 | 28.6 | 25.8 |
-
In 2023, although the percentage of new female employees dropped from the previous year, the number of new female employees rose by 60%.
Number of Employees, Years of Continuous Service, Turnover Rate
| Indicators | Gender | Unit | FY2021 | FY2022 | FY2023 | FY2024 | FY2025 |
|---|---|---|---|---|---|---|---|
| Number of employees | Men | (Persons) | 1,530 | 1,530 | 1,541 | 1,569 | 1,589 |
| Women | 152 | 157 | 172 | 177 | 189 | ||
| Total | 1,682 | 1,687 | 1,713 | 1,746 | 1,778 | ||
| Average years of service | Men | (Year) | 24.3 | 23.8 | 22.9 | 21.9 | 20.7 |
| Women | 18.8 | 17.8 | 16.2 | 14.6 | 14.3 | ||
| Total | 23.8 | 23.2 | 22.2 | 21.2 | 20.0 | ||
| Turnover rate | - | (%) | 1.2 | 1.3 | 1.9 | 2.0 | 2.5 |
-
Number of employees and average years of service do not include employees on loan.
-
Years of continuous service is on a downward trend because of the increase in male and female new hires.
-
We strive for an environment conducive to a comfortable long-term workplace, and the result has been a low employee turnover rate.
Salary
Male-Female Wage Gap (Female Wage as Percentage of Male Wage)
(%)
| Employee category | Male-female wage gap |
|---|---|
| All employees | 67.8 |
| Regular employees | 68.9 |
| Part-time and fixed-term employees | 39.9 |
Supplement: Male-Female Wage Gap for Regular Employees for Standard Wages Excluding Allowances, Etc.
(%)
| Employee category | Male-female wage gap |
|---|---|
| Managers | 85.8 |
| Career-track | 91.7 |
| Regular employees other than the above | 89.3 |
Period:
-
Fiscal 2025 (January 1 to December 31, 2025)
Wages:
-
Includes compensation for overtime and bonuses, but excludes commuting allowance, etc.
Regular employees:
-
Excludes employees on loan from NEG to other companies, or from other companies to NEG
Part-time and fixed-term employees:
-
Employees who have an employment contract for a fixed period
-
Notes:
-
Although we calculate wages for men and women based on the same standard, male-female wage gaps occur due to differences in things such as number of employees, employment categories, and years of continuous service. Other factors contributing to wage gaps include various allowances for shift work employees (of whom 97% are men) and the fact that there are relatively fewer women in senior management positions.
-
In the employee category of part-time and fixed-term employees, the difference in employment categories is a major reason for wage gaps
Employee Awareness Surveys
Fiscal 2025 Survey Results
| Unit | FY2022 | FY2023 | FY2024 | FY2025 | |
|---|---|---|---|---|---|
| Total number of respondents | (Persons) | 1,915 | 1,955 | 1,938 | 1,973 |
| Response rate | (%) | 97.8 | 99.7 | 99.6 | 99.2 |
Occupational Safety and Health; Health and Productivity Management
Industrial Accident Frequency Rate (NEG)
| FY2021 | FY2022 | FY2023 | FY2024 | FY2025 | |
|---|---|---|---|---|---|
| All industries in Japan | 2.1 | 2.1 | 2.1 | 2.1 | - |
| Manufacturing industry | 1.3 | 1.3 | 1.3 | 1.3 | - |
| NEG | 0.4 | 0.9 | 0.4 | 0.4 | 0.8 |
Industrial Accident Severity Rate (NEG)
| FY2021 | FY2022 | FY2023 | FY2024 | FY2025 | |
|---|---|---|---|---|---|
| All industries in Japan | 0.09 | 0.09 | 0.09 | 0.09 | - |
| Manufacturing industry | 0.06 | 0.08 | 0.08 | 0.06 | - |
| NEG | 0.01 | 0.01 | 0.00 | 0.03 | 0.00 |
Occupational Injury Rate per 1,000 Employees (Consolidated)
| FY2021 | FY2022 | FY2023 | FY2024 | FY2025 | |
|---|---|---|---|---|---|
| All industries | 2.30 | 2.30 | 2.40 | 2.30 | - |
| Manufacturing industry | 2.70 | 2.70 | 2.70 | 2.70 | - |
| NEG | 0.63 | 0.84 | 1.56 | 1.40 | 0.96 |
Indicators and Targets for Health and Productivity Management (NEG)
| KPI | FY2023 | FY2024 | FY2025 | FY2026 target |
| Rate of presenteeism*1 | 26.8% | 26.7% | 24.9% | Less than 23% |
|---|---|---|---|---|
| Rate of mental health leave*2 | 1.3% | 1.3% | 1.5% | Less than 1% |
-
Presenteeism: When employees go to work but are not fully productive due to some kind of health problem. A higher percentage is worse.
Response rates: 99.4% in fiscal 2023, 99.3% in fiscal 2024, and 98.7% in fiscal 2025 -
Rate of mental health leave: Percentage of employees taking leave due to mental illness.
Stress Check Participation Rate
| FY2023 | FY2024 | FY2025 | |
|---|---|---|---|
| Participation rate | 99.4% | 99.3% | 98.7% |
Percentage of Employees with High Stress
| FY2023 | FY2024 | FY2025 | |
|---|---|---|---|
| Percentage of employees identified as experiencing high stress | 12.1% | 13.1% | 12.0% |
Employee Smoking Rate
| FY2023 | FY2024 | FY2025 | |
|---|---|---|---|
| Percentage of employees who smoke | 24.3% | 24.0% | 22.8% |
Respecting Human Rights
Participation in Training Programs
(Persons)
| Training content | FY2022 | FY2023 | FY2024 | FY2025 |
|---|---|---|---|---|
| Cumulative number of employees participating in and dispatched to outside activities (government and external organizations) | 270 | 126 | 148 | 287 |
| Number of employees participating in in-house human rights activities | 818 | 1,360 | 1,328 | 107 |
-
The lower number of participating employees in fiscal 2025 was due to the Employee Human Rights Training Session not taking place within the fiscal year.
Communicating with Stakeholders
Number of Participants in Supplier Information Sessions
(Companies)
| Indicator | FY2025 |
|---|---|
| Number of companies attending the business partner briefing | 68 |
Survey of Suppliers
(Companies)
| Indicator | FY2025 |
|---|---|
| Number of companies taking the supplier survey | 104 |
Dialogue with Institutional Investors
(Companies)
| Total number of dialogues | FY2025 |
|---|---|
| Companies in Japan | 147 |
| Overseas companies | 188 |
| Total | 335 |
| Of which ESG was the main topic | 11 |
Governance
Corporate Governance
Total Amount of Directors’ and Corporate Auditors’ Remuneration in Fiscal 2025
| Category | Total amount of remuneration (million yen) | Total amount for each type of remuneration (million yen) | Number of eligible officers | ||
|---|---|---|---|---|---|
| Fixed remuneration | Performance-linked remuneration | Non-monetary remuneration | |||
| Directors (Number of outside directors) |
303 (39) |
209 (39) |
63 (-) |
29 (-) |
9 (4) |
| Corporate auditors (Number of outside corporate auditors) |
55 (14) |
55 (14) |
- (-) |
- (-) |
5 (2) |
|
Total (Number of outside directors) |
358 (54) |
265 (54) |
63 (-) |
29 (-) |
14 (6) |
Number of Stocks and Amount of Strategic Shareholdings Reported on the Balance Sheet
| Unit | FY2021 | FY2022 | FY2023 | FY2024 | FY2025 | |
|---|---|---|---|---|---|---|
| No. of stocks | (Stocks) | 29 | 26 | 23 | 19 | 17 |
| Amount | (Million yen) | 40,516 | 35,852 | 38,095 | 37,295 | 35,980 |
Compliance
Number of Whistleblowing Reports and Consultations Received through the NEG Hotline (Consolidated)
| FY2021 | FY2022 | FY2023 | FY2024 | FY2025 | |
|---|---|---|---|---|---|
| Number of Whistleblowing or Consultations | 12 | 25 | 16 | 18 | 33 |
Compliance Education, Workshops, and Lectures Held in Fiscal 2025
| Region | Name | Intended persons | Times | Participants | Theme |
|---|---|---|---|---|---|
| Japan | Education for new employees (new graduates) | All new employees (new graduates) | 3 | 58 |
|
| E-learning | Executives and employees at NEG and subsidiaries in Japan | - | 2,718 |
|
|
| Lectures | Executives and general managers at NEG, representatives of subsidiaries in Japan, area branch managers | 1 | 69 |
|
|
| Antitrust seminar for sales departments | NEG employees engaged in sales activities | 1 | 106 |
|
|
| Overseas | Workshops | Managers of subsidiaries in Europe, North America, and Malaysia | - | 147 |
|
Number of Infraction Requiring Legal Action (Consolidated)
| FY2023 | FY2024 | FY2025 | |
|---|---|---|---|
| Numbers | 0 | 0 | 0 |
Related Information
Sustainability
Message from the President
Sustainability Foundation
Materiality
Environment
Our Approach to Protecting the Environment
Environmental Management
Addressing Climate Change
Using Resources Efficiently
Consideration for the Environment
Environmentally Friendly Products and Services
Green Loan
Social
Human Resources Policy
Respecting Human Rights
Human Resource Development
Diversity and Inclusion
Better Workplace Environment
Employee Health and Safety
Communicating with Stakeholders
Society and Community
Governance
Corporate Governance
Internal Control
Risk Management
Compliance
External Evaluation and Third-Party Verification
Integrated Report
ESG Data
GRI Index